Northwest Early Learning has adopted this framework as a roadmap for building a comprehensive, coordinated, and effective early learning system across our five counties. More information about the Early Learning Plan online.
Green handprints in the report are used to indicate special community efforts to foster resilience in children, families, and systems.
How to Read the Data Tables: Up & down arrows ( ↑ ↓ ) in the data tables indicate the data value has increased or decreased (by any amount) over the previous year. No arrow indicates that the numbers haven’t changed. Right arrow (→) indicates that there are no new data for that indicator, an asterisk (*) indicates a new data indicator and a triangle (Δ) indicates data is calculated differently from last year.
Sources: Data included in the report were collected from both primary and secondary sources based on the best data available at the time of development. We rely on early learning professionals to provide information about the children and families they serve. We also refer to state data sources throughout.
Ready & Successful Framework
| Data Indicator | Island | San Juan | Skagit | Snohomish | Whatcom | State |
|---|---|---|---|---|---|---|
| Number of children under age 5 0 | 5,408^ | 464^ | 7,398^ | 48,827^ | 11,638^ | 454,134^ |
| Children under 6 who live in families in extreme poverty 1 | 7.4%^ | 16.4%v | 9.1%v | 7%v | 5.6%v | 7.8%v |
| Children served by Children’s Administration (CPS, Child Welfare, Family Reconciliation, etc.) 2 | 1,013v | 124^ | 2,218^ | 10,982^ | 3,727^ | 112,182^ |
| Number foster care placements, ages 0-17 3 | 63v | <10 | 146^ | 755^ | 319 | 9,530^ |
| Children with developmental delays, ages birth-3, served by Early Services for Infants & Toddlers (ESIT) 4 | 197^ | 28^ | 197 | 2,102^ | 572^ | 17,658^ |
| Kindergartners meeting or exceeding standards by area of development in Fall 2017: | ||||||
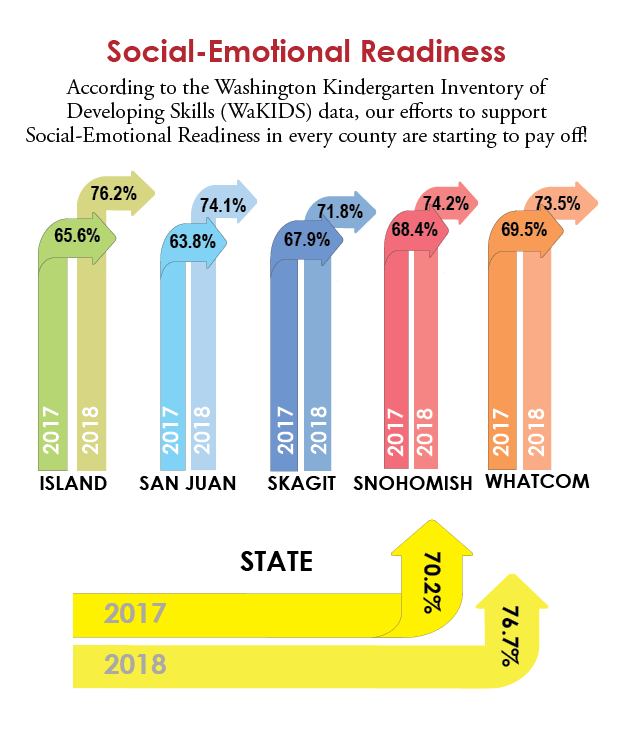
| Social-Emotional standards 5 | 76.2%^ | 74.1%^ | 71.8%^ | 74.2%^ | 73.5%^ | 76.7%^ |
| Physical standards 6 | 84.8%^ | 86.4%^ | 82.2%^ | 83.2%^ | 87.8%^ | 82.3%^ |
| Language standards 7 | 74.6%v | 69.1%v | 68.3%v | 69.6%v | 74.9%v | 71.6%v |
| Cognitive standards 8 | 68.8%v | 64.2%v | 67.8%v | 69.3%v | 75.2%v | 71.6%v |
| Literacy standards 9 | 84.2%v | 87.5%v | 64.3%v | 74.8%v | 77.0%v | 77.5%v |
| Math standards 10 | 70.0%v | 77.8%v | 56.2%^ | 63.3%v | 62.6%v | 66%- |
| Percentage of students meeting 3rd Grade Reading Standards * 11 | 51.2%v | 64.3%v | 49.9%^ | 55.0%v | 51.5%v | 53.6%- |
| 8th graders with depressive symptoms → 12 | 24% | 29% | 30% | 27% | 26% | 28% |
| On-time graduation rate, public schools (2016-2017) Δ 13 | 83.3% | 82.5% | 73.3% | 79.5% | 77.0% | 79.3% |
 |
 |
|---|---|
| Source: OSPI Washington State Report Card. Filtered by ESD 189, year (2017-18, and a category of students. Data updated since 2017 report. | Source: OSPI Washington State Report Card. Data updated since 2017 report. |
0Source: Estimates of April 1 population by age, sex, race and Hispanic origin, Washington State Office of Financial Management (OFM) Note: County (Special Age Groups), 2010-2017. Data updated since 2017 Report.
1 Source: Children under 6 in extreme poverty (5-year average). American Community Survey, 2012-2016 Age by the ratio of income to the poverty level in past 12 months (Table B17024). Note: By County. Extreme poverty as 0.5 or less of the poverty level. Data updated since 2017 Report.
2 Source: DSHS Client Services. Note: Children’s Administration Services include filtered by the fiscal year 2017, youth (0-17), county. State Fiscal year 2017. Data updated since 2017 Report.
3 Source: DSHS Client Services. Foster Care Placement Services Clients. Note: Filter by youth (0-17), county. State Fiscal Year 2017. Data updated since 2017 Report.
4 Source: DEL/DCYF, Number of children served on an IFSP for the period July 1, 2017, to June 30, 2018 (provided by DCYF). Note: Sent by Susan Franck, M.E.d. Data Manager | Early Support for Infants and Toddlers. Data updated since 2017 report.
5 Source: OSPI Washington State Report Card. Data updated since 2017 report.
6 Source: OSPI Washington State Report Card. Data updated since 2017 report.
7 Source: OSPI Washington State Report Card. Data updated since 2017 report.
8 Source: OSPI Washington State Report Card. Data updated since 2017 report.
9 Source: OSPI Washington State Report Card. Data updated since 2017 report.
10 Source: OSPI Washington State Report Card. Data updated since 2017 report.
11 Source: OSPI Washington State Report Card. Note: 2017 Data Files, AIM-EOC-MSP-SBA Assessments District, excel file. New data indicator.
12 Source: Healthy Youth Survey. Note: Filtered by Year (2016), County, “Depressive Feelings & Suicide.” Data not updated since 2017 report.
13 Source: K-12 Data and Reports, Data and Analytics. Note: Graduation Rates. Compiled districts into counties. Data not updated since 2017 report.
| Data Indicator | Island | San Juan | Skagit | Snohomish | Whatcom | State |
|---|---|---|---|---|---|---|
| Households with children under age of 6 0 | 2,032^ | 217v | 2,403v | 20,188^ | 4,387v | 180,820v |
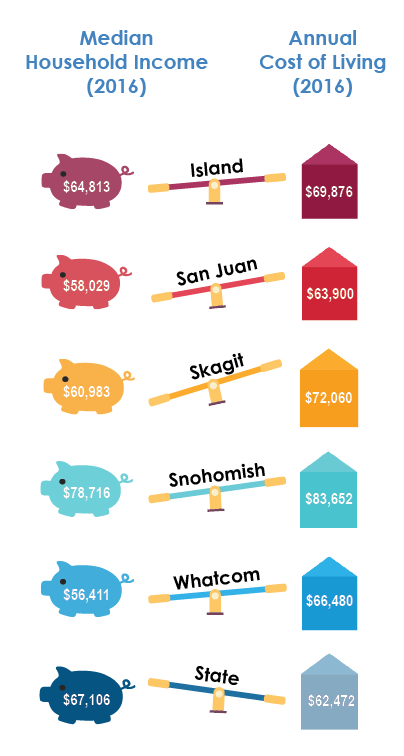
| Estimated Basic Annual cost of living for family with 2 adults, 1 preschooler, 1 infant, 1 preschooler (2016) 1 | $69,876^ | $63,900^ | $72,060^ | $83,652^ | $66,480^ | $62,472^ |
| Median Household Income (2016) * 2 | $64,813 | $58,029 | $60,983 | $78,716 | $56,411 | $67,106 |
| Unemployment rate (July 2018) 3 | 4.9%^ | 3.1%v | 4.8%v | 3.8%^ | 4.4% | 4.6%^ |
| Homeless individuals living in family units 4 | 166v | 57v | 338v | 858v | 816^ | 22,416^ |
| Children participating in the Basic Food Program 5 | 19%v | 17%v | 36%v | 21%v | 26%v | 29%v |
| Percent of births that qualified for Medicaid assistance (2015) → 6 | 28.6% | 58.8% | 63.1% | 40.7% | 52.1% | 49.2% |
| Mothers receiving prenatal care in the first trimester (2015) → 7 | 74.6% | 71.1% | 68.6% | 73.0% | 67.3% | 73.7% |
| Total individuals served by Women Infants & Children (WIC) supplemental nutrition 8 | 2,741v | 332^ | 6,037v | 19,404v | 6,734v | 274,888v |
| Number of spaces available in Early Head Start, including migrant and tribal 9 | 27 | 0 | 66v | 181v | 113 | 3,264v |
| Teen birth rate (15-19 years) (2016) 10 | 46v | 2v | 116^ | 473v | 132v | 5,396v |
| Teen pregnancy (15-19 years) per 1,000 (2016) * 11 | 14.4 | <5 | 21 | 11.8 | 9.3 | 16.2 |
 |
 |
|---|---|
| Source: Childcare Aware of Washington. 2018 County Data Reports. The Bellingham Herald. Thinking about Having Kids? You’re Already Behind When It Comes to Child Care. | Source: United Way ALICE (Asset Limited, Income Constrained, Employed) Washington, July 2018. Note: Figures based on 2016 American Community Survey estimates. Click on Downloads, County Pages, “2016 Point in Time Data.” 2018 County Data Reports. |
0Source: US Census American Fact Finder American Community Survey. Note: Table S1101, American FactFinder 2016-2016 ACS 5 Year Estimates.
1Source: United Way ALICE (Asset Limited, Income Constrained, Employed) Washington, July 2018. Note: Figures based on 2016 American Community Survey estimates. Click on Downloads, County Pages, “2016 Point in Time Data.”
2Source: United Way ALICE (Asset Limited, Income Constrained, Employed) Washington, July 2018. Note: Figures based on 2016 American Community Survey estimates. Click on Downloads, County Pages, “2016 Point in Time Data.”
3 Source: Washington State Employment Security Department, Map of county unemployment rates. Note: Figures for July 2018. Data updated since 2017 report.
4Source: Department of Commerce Note: 2018 PIT (Point in Time) County Summary (Excel Document). Data updated since 2017 report.
5Source: DSHS Client Services, Basic Food Program use rate (included in Economic Services). Note: Use rates are the percentage of the population that received service at some time during the year. (Client count/Pop Total) = use rate %. Filter by Fiscal Year (2017), age group, and county. Data updated since 2017 report.
6Source: Washington Health Care Authority, Data, and Reports, Reproductive Health, Medicaid status for women with births. Note: Births in 2015 (most recent data available). Data not updated since 2017 report.
7Source: Washington Health Care Authority, Data, and Reports, Reproductive Health, Medicaid status for women with births. Note: Births in 2015 (most recent data available). Data not updated since 2017 report.
8Source: Washington State Department of Health, WIC Data by County- Federal Fiscal Year 2017. Note: The number of clients participating in WIC during FFY17. A client is counted only once per agency in the county where they received services, even if they were in multiple categories during FFY2017. Due to factors such as client relocation during FFY2017, approximately 4.6% of clients are likely counted as participating in more than one agency. Data updated since 2017 report.
9Source: Washington State Department of Early Learning/DCYF, Early Learning Management System (ELMS). Note: 2017-18 figures. Data updated since 2017 Report.
10Source: Washington State Department of Health. Induced Abortion/Pregnancy Tables by Topic, Years 1997-2016. Table 16. Note: 2016 figures. Data not updated since 2017 report.
11Source: Washington State Department of Health. DOH Demographic Tables, 1980-2016, Table A10. Note: 2016 figures. Data not updated since 2017 report.
| Data Indicator | Island | San Juan | Skagit | Snohomish | Whatcom | State |
|---|---|---|---|---|---|---|
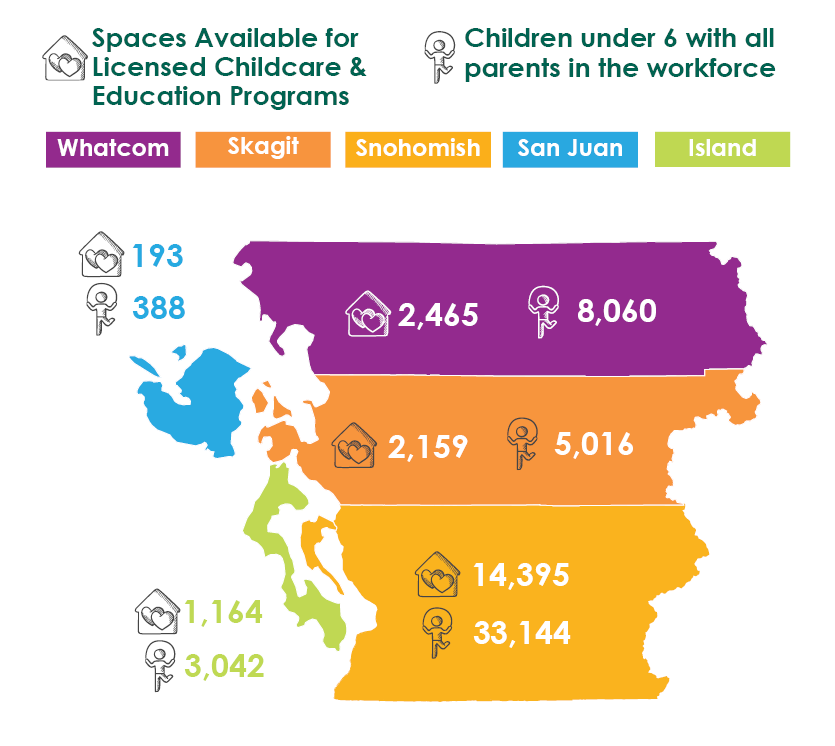
| Children under 6 with all parents in the workforce 0 | 3,042v | 388v | 5,016v | 33,144^ | 8,060^ | 305,216v |
| Percent of children under 6 with all parents in the workforce 1 | 60.1%v | 67.5%v | 61.5%^ | 59%v | 60.9%^ | 59.1%v |
| Number of spaces for 3 & 4 yr olds in state & Federally funded preschool (ECEAP & Head Start) 2 | 173v | 55^ | 379v | 1,702^ | 620v | 24,964v |
| Number of licensed child care and education programs – centers and family homes. 3 | 41 | 6 | 87v | 461v | 85v | 5,005v |
| Number of spaces for children in licensed child care and educational programs – centers and family homes 4 | 1,164v | 193 | 2,159v | 14,395v | 2,465v | 147,412^ |
| Percent of licensed child care providers enrolled in Early Achievers 5 | 72%^ | 100% | 92%^ | 61%v | 76%^ | 70%v |
| Coalition members of affiliated with Northwest Early Learning 6 | 100 | 38 | 61 | 68 | 120 | N/A |
 |
 |
|---|---|
| Source: Child Care Aware of Washington, 2017 Data Report. Note: Report published January 1, 2018. American Community Survey 2016, 5-year estimates (Table ID: B23008). Note: 2012-2016 ACS 5 Year Estimates. | Source: Childcare Aware of Washington. 2018 County Data Reports. |
0 Source: American Community Survey 2016, 5-year estimates (Table ID: B23008). Note: 2012-2016 ACS 5 Year Estimates.
1Source: American Community Survey 2016, 5-year estimates (Table ID: B23008). Note: 2012-2016 ACS 5 Year Estimates.
2 Source: Provided by DCYF. Note: 2017-2018 figures.
3 Source: Child Care Aware of Washington, 2017 Data Report. Note: Report published January 1, 2018.
4 Source: Child Care Aware of Washington, 2017 Data Report. Note: Report published January 1, 2018.
5 Source: Child Care Aware of Washington, 2017 Data Report. Note: Report published January 1, 2018.
| Data Indicator | Island | San Juan | Skagit | Snohomish | Whatcom | State |
|---|---|---|---|---|---|---|
| K-12 enrollment, public schools 0 | 8,291^ | 1,794v | 19,148^ | 110,021^ | 27,577 ^ | 1,100,779^ |
| Kindergarten enrollment, public schools 1 | 657 | 102v | 1,418v | 8,019^ | 2,054^ | 80,981^ |
| Free & Reduced Lunch Enrollment 2 | 34.9% | 34.7%^ | 50.1%v | 35.5%v | 40.2%v | 42.9%v |
| Percent of students that are Transitional Bilingual – English Language Learners 3 | 3.1%^ | 5.3%^ | 14.2%v | 10.5%v | 7.3%^ | 11.3%^ |
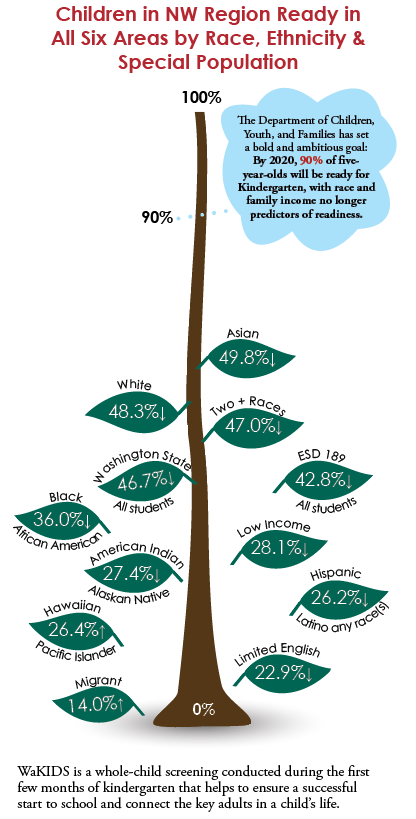
| Percent of incoming kindergarteners READY in all 6 areas of development, fall 2016 4 | 50.1%^ | 50.0%v | 35.8%v | 42.5%v | 46.3%v | 46.7%v |
| Percent of incoming kindergarteners NOT ready in any area of development, fall 2016 5 | 5.1%^ | 6.3%v | 5.7% | 5.5%^ | 4.3%^ | 5.8%^ |
| Number of districts that met at least one age expectation target for children (Birth-3) with IEPs 6 | 1/3 | 2/3 | 6/7 | 11/14 | 5/7 | N/A |
| Students from low-income households who graduated high school in four years 7 | 74.4%v | 78.1%^ | 64.3%v | 69.3%v | 64.9%v | 70.0%^ |
| Districts in the region that accepted PreK-K Transition Reports out of total number of districts 8 | 3/3 | 4/4^ | 7/7^ | 13/14^ | 7/7 | N/A |
| Number of Regional Transition Reports shared between preschool and kindergarten teachers 9 | 144v | 65v | 307^ | 832^ | 428^ | 1,776^ |
Source: Villani, A. (2018). WaKIDS Smarter Balanced Assessment (SBA) Data Brief. Olympia, WA: Office of the Superintendent for Public Instruction (OSPI).
0 Source: OSPI, School Year 2017-18. Oct 1, 2017, Enrollment Data as of 1/22/2018, County Level.
1 Source: OSPI, School Year 2017-18. Oct 1, 2017, Enrollment Data as of 1/22/2018, County Level.
2 Source: OSPI, 2017 Data Files, Demographic Information by District.
3 Source: OSPI, 2017 Data Files, Demographic Information by District
4 Source: OSPI, Washington State Report Card, 2018 Data Files, WaKIDs by District.
5 Source: OSPI, Washington State Report Card, 2018 Data Files, WaKIDs by District.
6 Source: OSPI, Data, and Reporting, Special Education Annual Performance Report.
7 Source: OSPI, Dropout and Graduation Reports, 2016-17. Appendix B, County Adjusted 4 year (updated March 2018).
| Data Indicator | Island | San Juan | Skagit | Snohomish | Whatcom | State |
|---|---|---|---|---|---|---|
| Working poor (ALICE: Asset Limited, Income Constrained, Employed + Federal poverty level) 0 | 25.2%v | 28.8%v | 32.3%v | 35.4%^ | 22.5%v | 27.7%v |
| Combined households below US poverty and those that earn over poverty level but less than the basic cost of living: | ||||||
| Asian households 1 | 36.9% | 76.4%^ | 50.2%^ | 41.3%^ | 38.2%v | 35.6% |
| Black households 2 | 48.9%^ | N/A | 83.0%^ | 60.0%^ | 63.8%v | 60.3% |
| Hispanic households 3 | 59.9%^ | 61.1%^ | 63.3%^ | 65.8%^ | 55.4%^ | 56.0% |
| White households 4 | 35.1%^ | 37.2%^ | 41.4%^ | 41.3%^ | 37.6%v | 35.6% |
| Number of partner organizations affiliated with Northwest Early Learning 5 | 40^ | 25^ | 41^ | 38^ | 36^ | N/A |
| Participants at PreK-K Collaborative Network Dinner & Dialogues, Spring 2018 6 | Coming Fall 2018 | 46^ | 42 | Coming Fall 2018 | 99^ | N/A |
 |
 |
|---|---|
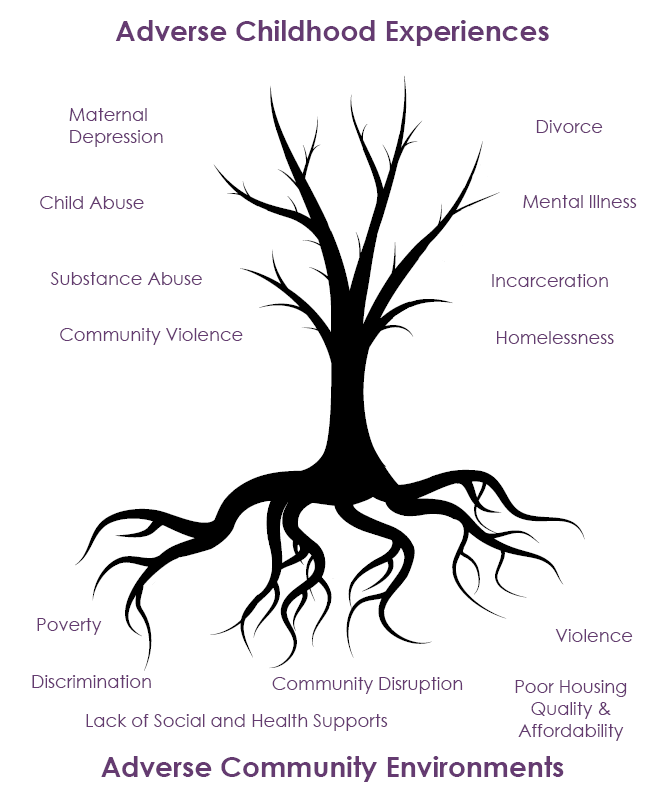
| Source: Pair of ACEs Tree. Building Community Resilience. |
0 Source: United Way ALICE (Asset Limited, Income Constrained, Employed) Research Center, Selected State, and County Details.
1 Source: United Way ALICE (Asset Limited, Income Constrained, Employed) Research Center, County Details. Note: Scroll Down to table, “Households by Race/Ethnicity” for each county.
2 Source: United Way ALICE (Asset Limited, Income Constrained, Employed) Research Center, County Details. Note: Scroll Down to table, “Households by Race/Ethnicity” for each county.
3 Source: United Way ALICE (Asset Limited, Income Constrained, Employed) Research Center, County Details. Note: Scroll Down to table, “Households by Race/Ethnicity” for each county.
4 Source: United Way ALICE (Asset Limited, Income Constrained, Employed) Research Center, County Details. Note: Scroll Down to table, “Households by Race/Ethnicity” for each county.