Index and Glossary
- Ready & Successful Children
- Ready & Successful Families
- Ready & Successful Professionals
- Ready & Successful Schools
- Ready & Successful Communities & Systems

| Data Indicator | Island | San Juan | Skagit | Snohomish | Whatcom | State |
|---|---|---|---|---|---|---|
| Households with children under age of 6 1 | 1,898 | 315** | 2,592 | 20,670 | 4,438 | 187,953 |
| Annual cost of living for family with 2 adults, 1 preschooler, 1 infant 2 | $56,088 | $57,864 | $56,604 | $61,428 | $57,672 | $52,152 |
| Unemployment rate 3 | 6.4%v | 4.5%v | 6.8%v | 4.8%v | 6.4%v | 5.7%v |
| Homeless families 4 | 126^ | 74^ | 351^ | 829v | 652^ | 19,418 |
| Children participating in the Basic Food Program 5 | 23%v | 25%v | 43%v | 26%v | 31%v | 34%v |
| Percent of births that qualified for Medicaid assistance 6 | 35.2% | 55.6 | 61.5% | 40.6% | 50.3% | 48.8% |
| Mothers receiving prenatal care in the first trimester 7 | 74.1%v | 64.4%v | 63.5%v | 67.2% | 67.4%v | 68.3%v |
| Families served by Women Infants & Children (WIC), supplemental nutrition 8 | 2,912v | 360v | 6,112v | 21,612v | 7,158v | 289,945v |
| Number of spaces available in Early Head Start, including migrant and tribal 9 | 27 | 0 | 66 | 40 | 113^ | 2,770 |
| Teen birth rate (15-17 years) per 100010 | 6.8 per 1000 | <5 per 1000 | 9.6 per 1000 | 6.5 per 1000 | 5.3 per 1000 | 8.3 per 1000 |
| Teen pregnancy (15-19 years)11 | 54v | 4 | 115v | 507v | 161v | 6,035 |
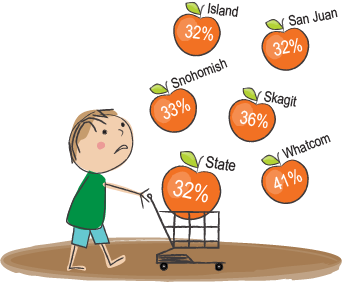
Struggling Households
|
Source: 2013 United Way ALICE Report Note: ALICE, an acronym for Asset Limited, Income Constrained, Employed, are households that earn more than the U.S. poverty level, but less than the basic cost of living for the county. Combined, the number of poverty and ALICE households equals the total population struggling to afford basic needs. |
| Source: 2013 United Way ALICE Report Note: ALICE, an acronym for Asset Limited, Income Constrained, Employed, are households that earn more than the U.S. poverty level, but less than the basic cost of living for the county. Combined, the number of poverty and ALICE households equals the total population struggling to afford basic needs. |
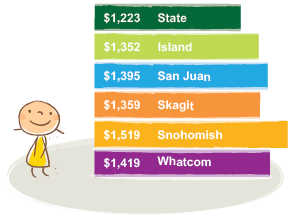
Minimum Child Care
|
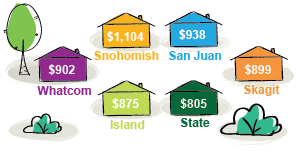
Minimum Housing
|
Source: 2013 United Way ALICE Report Note: ALICE, an acronym for Asset Limited, Income Constrained, Employed, are households that earn more than the U.S. poverty level, but less than the basic cost of living for the county. Combined, the number of poverty and ALICE households equals the total population struggling to afford basic needs. |
1 Source: U.S. Census Bureau Note: **San Juan data taken from U.S. Census Bureau, 2012 American Community Survey
2 Source: 2013 United Way ALICE (Asset Limited, Income Constrained, Employed) Report data
3 Source: July 2016, Washington State Employment Security Department Note: Persons aged 16 years and older had no employment during the reference week, were available for work, except for temporary illness, and had made specific efforts to find employment sometime during the 4-week period ending with the reference week. Persons who were waiting to be recalled to job from which they had been laid off need not have been looking for work to be classified as unemployed.
4 Source: 2015 Washington State Department of Commerce Point in Time and Housing Inventory Count of Homeless Persons Note: Point-in-Time Count as a "count of sheltered and unsheltered homeless persons carried out on one night in the last 10 calendar days of January or at such other time as required by Housing and Urban Development (HUD). For the point in time count. persons living in emergency shelters (including motel/hotel vouchers), transitional housing, or unsheltered (in places not meant for human habitation, such as cars, parks, sidewalks, abandoned buildings, on the street) are counted. Persons living in a dwelling lacking any of the following should be considered homeless" drinking water, restroom, heat, ability to cook hot food, or ability to bathe. Persons living temporarily with family or friends due to loss of housing, economic hardship, or a similar reason (often referred to as "doubled-up" or "couch surfing") do not meet the HUD definition of homeless. There is no requirement to count these individuals; however this data is useful in identifying the need for housing and services.
5 Source: 2014 Client counts come from the Washington state Department of Social and Health Services (DSHS), Research and Data Analysis, Client Services Database which compiles client service and expenditures records from more than 20 of the agency's client record and payment systems. The figures reported here are also referred to as “User rates” in their annual report. Data were retrieved on June 22, 2016 from https://www.dshs.wa.gov/sesa/research-and-data-analysis/client-data. ALSO page 4 of this data: https://www.dshs.wa.gov/sites/default/files/ESA/briefing-manual/2015Basic_Food_Assistance.pdf Note: Number and percent of children under age 18 who are served by the Basic Food Program. Note that even though the number of under 18 children served represents income-eligible children, the percent figures do not represent percent of all income-eligible children served. Instead, the percent figures represent percent of all under 18 children in the area, regardless of income level. Therefore, in percentage calculation, the numerator is number of under 18 children served while the denominator is total under 18 child population.
6 Source: 2014 State of Washington – First Steps Database: Eligibility status for Washington women with Medicaid-paid births in 2014. Note: Eligibility for Medicaid is based on family income and citizenship status, and was obtained from eligibility history at the time of birth. S-Women numbers do not include undocumented women. Some women who received Medicaid services were eligible through programs other than those specified above, or did not have a Medicaid eligibility history record. Percentages (%) refer to the percent of total women giving birth. As of 2014, records do not include out-of-state deliveries to Washington residents because birth certificates for states other than Washington were not available for record linkage.
7 Source: 2014 Washington State Health Care Authority
8 Source: FFY 2015, Washington State Department of Health
10Source: 2014 Teen birth rate (15-17): Annie E Casey Kids Count Data Center Note: Births to teenagers ages 15-17. Rate is per 1,000 females in this age group. This measure of teenage child bearing focuses on the fertility of all females ages 15 to 17. The age range for teen birth rate was change from 15-19 to 15-17 this year.
11Source: 2014 Teen pregnancy: Annie E Casey Kids Count Data Center Note: Teenagers 15 through 19 years of age who were pregnant, regardless of material status. Pregnancy outcomes could be live births, abortions, or fetal deaths. Therefore, total pregnancy equals the sum of live births, abortions, and fetal deaths. Rates represent the number of pregnancies to 15-19 year old women per 1,000 women of this age group.